Reports
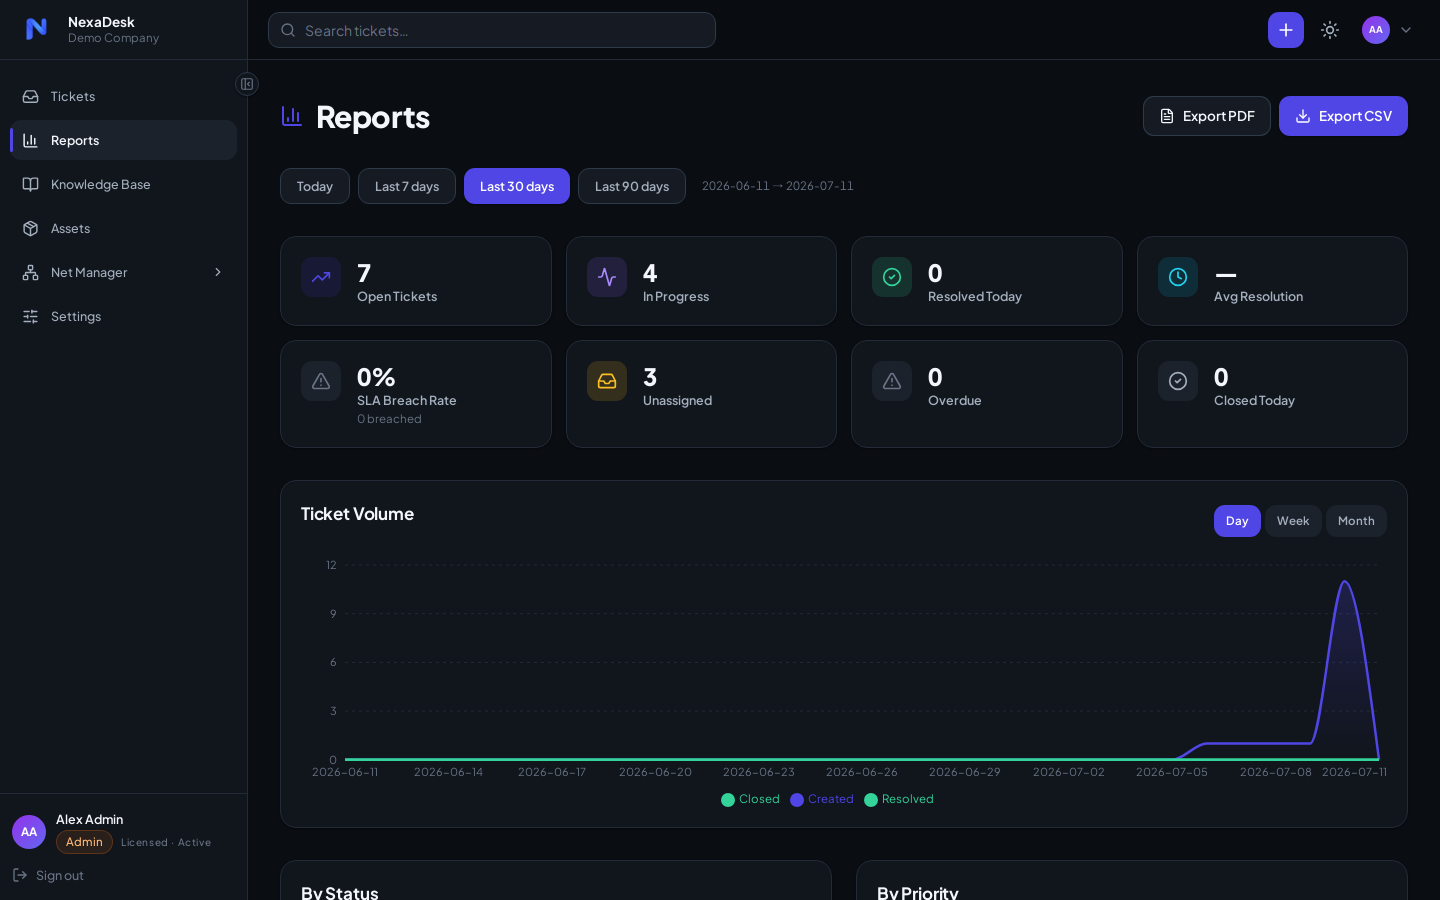
Settings-free analytics for admins and technicians, at Reports in the sidebar.
Date ranges
Presets for Today, Last 7 days, Last 30 days, Last 90 days — the active range is shown beside the buttons.
KPI tiles
Open Tickets, In Progress, Resolved Today, Average Resolution time, SLA Breach Rate, Unassigned, Overdue, and Closed Today.
Charts
- Ticket Volume — created / resolved / closed trend, switchable between Day, Week, and Month grouping
- By Status / By Priority / By Category / By Channel breakdowns
- SLA performance — met vs breached, per priority
- Technician performance table — who's resolving what, how fast
Exports
- Export CSV — raw data for your own analysis
- Export PDF — a shareable snapshot for management